matplotlib.patches.Ellipse#
- class matplotlib.patches.Ellipse(xy, width, height, *, angle=0, **kwargs)[source]#
Bases:
PatchA scale-free ellipse.
- Parameters:
- xy(float, float)
xy coordinates of ellipse centre.
- widthfloat
Total length (diameter) of horizontal axis.
- heightfloat
Total length (diameter) of vertical axis.
- anglefloat, default: 0
Rotation in degrees anti-clockwise.
Notes
Valid keyword arguments are:
Property
Description
a filter function, which takes a (m, n, 3) float array and a dpi value, and returns a (m, n, 3) array and two offsets from the bottom left corner of the image
unknown
bool
antialiasedor aabool or None
CapStyleor {'butt', 'projecting', 'round'}bool
Patch or (Path, Transform) or None
color
edgecoloror eccolor or None
facecoloror fccolor or None
bool
str
{'/', '\', '|', '-', '+', 'x', 'o', 'O', '.', '*'}
bool
JoinStyleor {'miter', 'round', 'bevel'}object
linestyleor ls{'-', '--', '-.', ':', '', (offset, on-off-seq), ...}
linewidthor lwfloat or None
bool
None or bool or float or callable
bool
(scale: float, length: float, randomness: float)
bool or None
str
bool
float
- property angle#
Return the angle of the ellipse.
- property center#
Return the center of the ellipse.
- get_corners()[source]#
Return the corners of the ellipse bounding box.
The bounding box orientation is moving anti-clockwise from the lower left corner defined before rotation.
- get_patch_transform()[source]#
Return the
Transforminstance mapping patch coordinates to data coordinates.For example, one may define a patch of a circle which represents a radius of 5 by providing coordinates for a unit circle, and a transform which scales the coordinates (the patch coordinate) by 5.
- property height#
Return the height of the ellipse.
- set(*, agg_filter=<UNSET>, alpha=<UNSET>, angle=<UNSET>, animated=<UNSET>, antialiased=<UNSET>, capstyle=<UNSET>, center=<UNSET>, clip_box=<UNSET>, clip_on=<UNSET>, clip_path=<UNSET>, color=<UNSET>, edgecolor=<UNSET>, facecolor=<UNSET>, fill=<UNSET>, gid=<UNSET>, hatch=<UNSET>, height=<UNSET>, in_layout=<UNSET>, joinstyle=<UNSET>, label=<UNSET>, linestyle=<UNSET>, linewidth=<UNSET>, mouseover=<UNSET>, path_effects=<UNSET>, picker=<UNSET>, rasterized=<UNSET>, sketch_params=<UNSET>, snap=<UNSET>, transform=<UNSET>, url=<UNSET>, visible=<UNSET>, width=<UNSET>, zorder=<UNSET>)[source]#
Set multiple properties at once.
Supported properties are
Property
Description
a filter function, which takes a (m, n, 3) float array and a dpi value, and returns a (m, n, 3) array and two offsets from the bottom left corner of the image
scalar or None
float
bool
antialiasedor aabool or None
CapStyleor {'butt', 'projecting', 'round'}(float, float)
bool
Patch or (Path, Transform) or None
color
edgecoloror eccolor or None
facecoloror fccolor or None
bool
str
{'/', '\', '|', '-', '+', 'x', 'o', 'O', '.', '*'}
float
bool
JoinStyleor {'miter', 'round', 'bevel'}object
linestyleor ls{'-', '--', '-.', ':', '', (offset, on-off-seq), ...}
linewidthor lwfloat or None
bool
None or bool or float or callable
bool
(scale: float, length: float, randomness: float)
bool or None
str
bool
float
float
- property width#
Return the width of the ellipse.
Examples using matplotlib.patches.Ellipse#
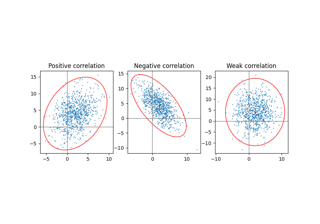
Plot a confidence ellipse of a two-dimensional dataset
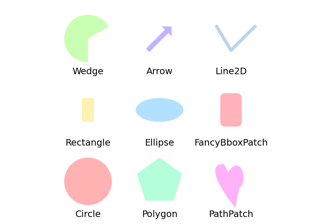
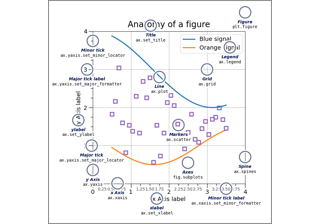
Reference for Matplotlib artists
Radar chart (aka spider or star chart)

