matplotlib.colors.LinearSegmentedColormap#

class matplotlib.colors.LinearSegmentedColormap(name, segmentdata, N=256, gamma=1.0)[source]#

Bases: Colormap

Colormap objects based on lookup tables using linear segments.

The lookup table is generated using linear interpolation for each primary color, with the 0-1 domain divided into any number of segments.

Create colormap from linear mapping segments

segmentdata argument is a dictionary with a red, green and blue entries. Each entry should be a list of x, y0, y1 tuples, forming rows in a table. Entries for alpha are optional.

Example: suppose you want red to increase from 0 to 1 over the bottom half, green to do the same over the middle half, and blue over the top half. Then you would use:

cdict = {'red':   [(0.0,  0.0, 0.0),
                   (0.5,  1.0, 1.0),
                   (1.0,  1.0, 1.0)],

         'green': [(0.0,  0.0, 0.0),
                   (0.25, 0.0, 0.0),
                   (0.75, 1.0, 1.0),
                   (1.0,  1.0, 1.0)],

         'blue':  [(0.0,  0.0, 0.0),
                   (0.5,  0.0, 0.0),
                   (1.0,  1.0, 1.0)]}

Each row in the table for a given color is a sequence of x, y0, y1 tuples. In each sequence, x must increase monotonically from 0 to 1. For any input value z falling between x[i] and x[i+1], the output value of a given color will be linearly interpolated between y1[i] and y0[i+1]:

row i:   x  y0  y1
               /
              /
row i+1: x  y0  y1

Hence y0 in the first row and y1 in the last row are never used.

See also

LinearSegmentedColormap.from_list

Static method; factory function for generating a smoothly-varying LinearSegmentedColormap.

static from_list(name, colors, N=256, gamma=1.0)[source]#

Create a LinearSegmentedColormap from a list of colors.

Parameters:
namestr

The name of the colormap.

colorsarray-like of colors or array-like of (value, color)

If only colors are given, they are equidistantly mapped from the range \([0, 1]\); i.e. 0 maps to colors[0] and 1 maps to colors[-1]. If (value, color) pairs are given, the mapping is from value to color. This can be used to divide the range unevenly.

Nint

The number of rgb quantization levels.

gammafloat
resampled(lutsize)[source]#

Return a new colormap with lutsize entries.

reversed(name=None)[source]#

Return a reversed instance of the Colormap.

Parameters:
namestr, optional

The name for the reversed colormap. If it's None the name will be the name of the parent colormap + "_r".

Returns:
LinearSegmentedColormap

The reversed colormap.

set_gamma(gamma)[source]#

Set a new gamma value and regenerate colormap.

Examples using matplotlib.colors.LinearSegmentedColormap#

Bar chart with gradients

Bar chart with gradients

Bar chart with gradients
Scatter plots with a legend

Scatter plots with a legend

Scatter plots with a legend
Contour Demo

Contour Demo

Contour Demo
Contour Image

Contour Image

Contour Image
Contourf Demo

Contourf Demo

Contourf Demo
Contourf and log color scale

Contourf and log color scale

Contourf and log color scale
Image Demo

Image Demo

Image Demo
Image Masked

Image Masked

Image Masked
Image Nonuniform

Image Nonuniform

Image Nonuniform
Layer Images

Layer Images

Layer Images
pcolormesh

pcolormesh

pcolormesh
Shading example

Shading example

Shading example
Axes box aspect

Axes box aspect

Axes box aspect
Composing Custom Legends

Composing Custom Legends

Composing Custom Legends
Using a text as a Path

Using a text as a Path

Using a text as a Path
Creating a colormap from a list of colors

Creating a colormap from a list of colors

Creating a colormap from a list of colors
Reference for Matplotlib artists

Reference for Matplotlib artists

Reference for Matplotlib artists
Dolphins

Dolphins

Dolphins
Demo CurveLinear Grid2

Demo CurveLinear Grid2

Demo CurveLinear Grid2
Shaded & power normalized rendering

Shaded & power normalized rendering

Shaded & power normalized rendering
Manual Contour

Manual Contour

Manual Contour
AGG filter

AGG filter

AGG filter
Matplotlib logo

Matplotlib logo

Matplotlib logo
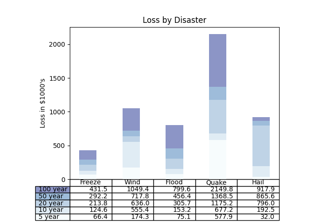
Table Demo

Table Demo

Table Demo
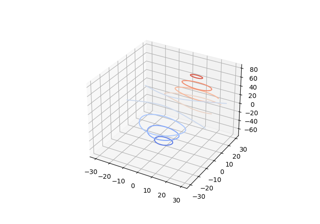
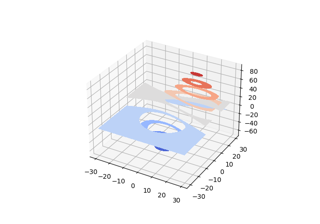
Demonstrates plotting contour (level) curves in 3D

Demonstrates plotting contour (level) curves in 3D

Demonstrates plotting contour (level) curves in 3D
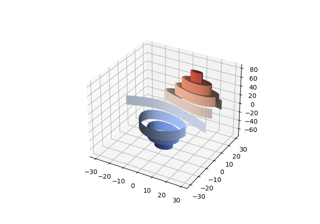
Demonstrates plotting contour (level) curves in 3D using the extend3d option

Demonstrates plotting contour (level) curves in 3D using the extend3d option

Demonstrates plotting contour (level) curves in 3D using the extend3d option
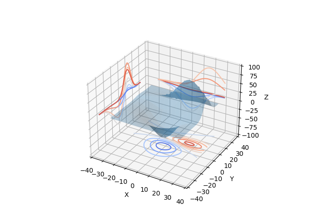
Projecting contour profiles onto a graph

Projecting contour profiles onto a graph

Projecting contour profiles onto a graph
Filled contours

Filled contours

Filled contours
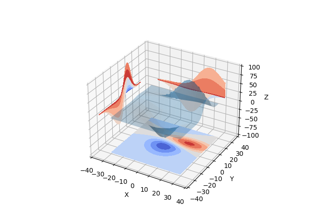
Projecting filled contour onto a graph

Projecting filled contour onto a graph

Projecting filled contour onto a graph
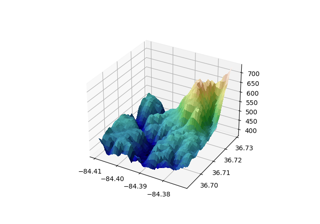
Custom hillshading in a 3D surface plot

Custom hillshading in a 3D surface plot

Custom hillshading in a 3D surface plot
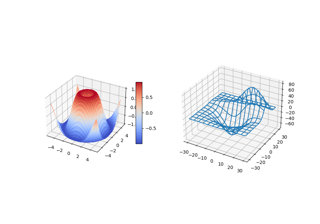
3D plots as subplots

3D plots as subplots

3D plots as subplots
3D surface (colormap)

3D surface (colormap)

3D surface (colormap)
3D surface with polar coordinates

3D surface with polar coordinates

3D surface with polar coordinates
Triangular 3D contour plot

Triangular 3D contour plot

Triangular 3D contour plot
Triangular 3D filled contour plot

Triangular 3D filled contour plot

Triangular 3D filled contour plot
More triangular 3D surfaces

More triangular 3D surfaces

More triangular 3D surfaces
Hillshading

Hillshading

Hillshading
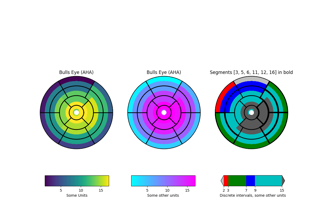
Left ventricle bullseye

Left ventricle bullseye

Left ventricle bullseye
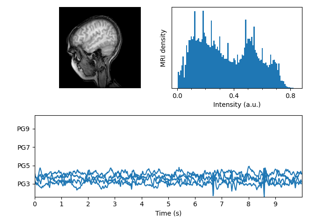
MRI with EEG

MRI with EEG

MRI with EEG
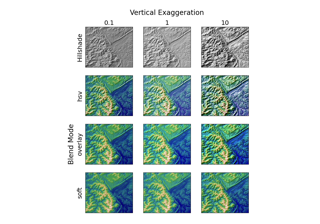
Topographic hillshading

Topographic hillshading

Topographic hillshading
Dropped spines

Dropped spines

Dropped spines
Colorbar Tick Labelling

Colorbar Tick Labelling

Colorbar Tick Labelling
Customized Colorbars Tutorial

Customized Colorbars Tutorial

Customized Colorbars Tutorial
Creating Colormaps in Matplotlib
Creating Colormaps in Matplotlib
Creating Colormaps in Matplotlib
Colormap Normalization

Colormap Normalization

Colormap Normalization