matplotlib.axis.Axis.grid#
- Axis.grid(visible=None, which='major', **kwargs)[source]#
Configure the grid lines.
- Parameters:
- visiblebool or None
Whether to show the grid lines. If any kwargs are supplied, it is assumed you want the grid on and visible will be set to True.
If visible is None and there are no kwargs, this toggles the visibility of the lines.
- which{'major', 'minor', 'both'}
The grid lines to apply the changes on.
- **kwargs
Line2Dproperties Define the line properties of the grid, e.g.:
grid(color='r', linestyle='-', linewidth=2)
Examples using matplotlib.axis.Axis.grid#
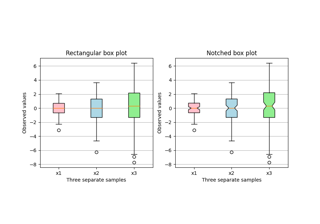
Box plots with custom fill colors
Box plots with custom fill colors
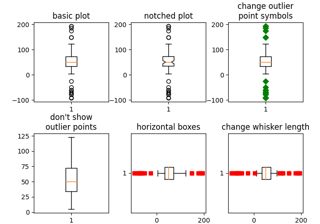
Boxplots
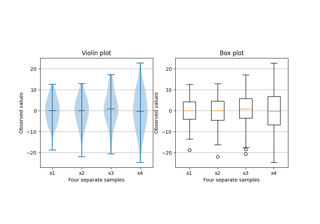
Box plot vs. violin plot comparison
Box plot vs. violin plot comparison
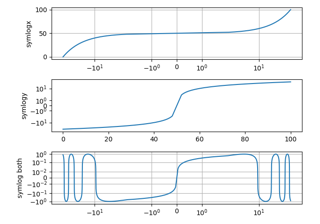
Symlog Demo


