API Reference#
When using the library you will typically create Figure and Axes objects and call their methods to add content and modify the appearance.
matplotlib.figure: axes creation, figure-level contentmatplotlib.axes: most plotting methods, Axes labels, access to axis styling, etc.
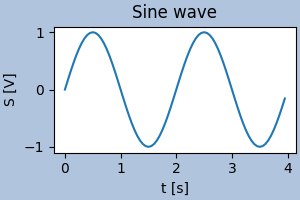
Example: We create a Figure fig and Axes ax. Then we call
methods on them to plot data, add axis labels and a figure title.
import matplotlib.pyplot as plt
import numpy as np

x = np.arange(0, 4, 0.05)
y = np.sin(x*np.pi)

fig, ax = plt.subplots(figsize=(3,2), constrained_layout=True)
ax.plot(x, y)
ax.set_xlabel('t [s]')
ax.set_ylabel('S [V]')
ax.set_title('Sine wave')
fig.set_facecolor('lightsteelblue')
(Source code, png)
Usage patterns#
Below we describe several common approaches to plotting with Matplotlib. See Matplotlib Application Interfaces (APIs) for an explanation of the trade-offs between the supported user APIs.
The explicit API#
At its core, Matplotlib is an object-oriented library. We recommend directly working with the objects if you need more control and customization of your plots.
In many cases you will create a Figure and one or more
Axes using pyplot.subplots and from then on only work
on these objects. However, it's also possible to create Figures
explicitly (e.g. when including them in GUI applications).
Further reading:
matplotlib.axes.Axesandmatplotlib.figure.Figurefor an overview of plotting functions.Most of the examples use the object-oriented approach (except for the pyplot section)
The implicit API#
matplotlib.pyplot is a collection of functions that make
Matplotlib work like MATLAB. Each pyplot function makes some change to a
figure: e.g., creates a figure, creates a plotting area in a figure, plots
some lines in a plotting area, decorates the plot with labels, etc.
pyplot is mainly intended for interactive plots and simple cases of
programmatic plot generation.
Further reading:
The
matplotlib.pyplotfunction reference
The pylab API (discouraged)#
Warning
Since heavily importing into the global namespace may result in unexpected
behavior, the use of pylab is strongly discouraged. Use matplotlib.pyplot
instead.
pylab is a module that includes matplotlib.pyplot, numpy, numpy.fft,
numpy.linalg, numpy.random, and some additional functions, all within
a single namespace. Its original purpose was to mimic a MATLAB-like way
of working by importing all functions into the global namespace. This is
considered bad style nowadays.
Modules#
Alphabetical list of modules:
matplotlibmatplotlib.afmmatplotlib.animationmatplotlib.artistmatplotlib.axesmatplotlib.axismatplotlib.backend_basesmatplotlib.backend_managersmatplotlib.backend_toolsmatplotlib.backendsmatplotlib.beziermatplotlib.blocking_inputmatplotlib.categorymatplotlib.cbookmatplotlib.cmmatplotlib.collectionsmatplotlib.colorbarmatplotlib.colorsmatplotlib.containermatplotlib.contourmatplotlib.datesmatplotlib.docstringmatplotlib.dvireadmatplotlib.figurematplotlib.font_managermatplotlib.fontconfig_patternmatplotlib.ft2fontmatplotlib.gridspecmatplotlib.hatchmatplotlib.imagematplotlib.layout_enginematplotlib.legendmatplotlib.legend_handlermatplotlib.linesmatplotlib.markersmatplotlib.mathtextmatplotlib.mlabmatplotlib.offsetboxmatplotlib.patchesmatplotlib.pathmatplotlib.patheffectsmatplotlib.pyplotmatplotlib.projectionsmatplotlib.quivermatplotlib.rcsetupmatplotlib.sankeymatplotlib.scalematplotlib.sphinxext.mathmplmatplotlib.sphinxext.plot_directivematplotlib.spinesmatplotlib.stylematplotlib.tablematplotlib.testingmatplotlib.textmatplotlib.texmanagermatplotlib.textpathmatplotlib.tickermatplotlib.tight_bboxmatplotlib.tight_layoutmatplotlib.transformsmatplotlib.trimatplotlib.type1fontmatplotlib.unitsmatplotlib.widgetsmatplotlib._apimatplotlib._enumsmpl_toolkits.mplot3dmpl_toolkits.axes_grid1mpl_toolkits.axisartist