matplotlib.axes.Axes.clabel#
- Axes.clabel(CS, levels=None, **kwargs)[source]#
Label a contour plot.
Adds labels to line contours in given
ContourSet.- Parameters:
- CS
ContourSetinstance Line contours to label.
- levelsarray-like, optional
A list of level values, that should be labeled. The list must be a subset of
CS.levels. If not given, all levels are labeled.- **kwargs
All other parameters are documented in
clabel.
- CS
Examples using matplotlib.axes.Axes.clabel#
Contour Demo
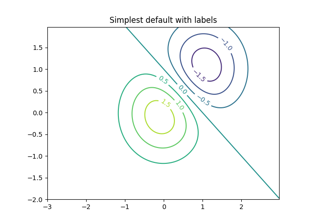
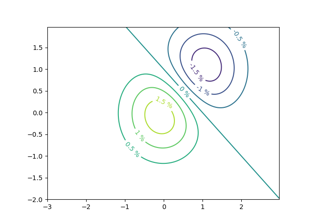
Contour Label Demo
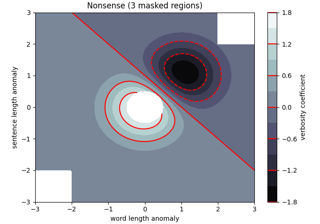
Contourf Demo
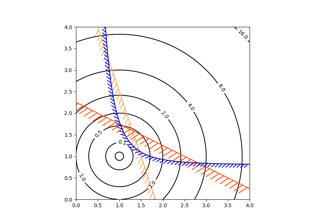
Contouring the solution space of optimizations
Contouring the solution space of optimizations
Patheffect Demo
TickedStroke patheffect
