matplotlib.axes.Axes.axhline#
- Axes.axhline(y=0, xmin=0, xmax=1, **kwargs)[source]#
Add a horizontal line across the Axes.
- Parameters:
- yfloat, default: 0
y position in data coordinates of the horizontal line.
- xminfloat, default: 0
Should be between 0 and 1, 0 being the far left of the plot, 1 the far right of the plot.
- xmaxfloat, default: 1
Should be between 0 and 1, 0 being the far left of the plot, 1 the far right of the plot.
- Returns:
- Other Parameters:
- **kwargs
Valid keyword arguments are
Line2Dproperties, with the exception of 'transform':Property
Description
a filter function, which takes a (m, n, 3) float array and a dpi value, and returns a (m, n, 3) array and two offsets from the bottom left corner of the image
scalar or None
bool
antialiasedor aabool
bool
Patch or (Path, Transform) or None
coloror ccolor
CapStyleor {'butt', 'projecting', 'round'}JoinStyleor {'miter', 'round', 'bevel'}sequence of floats (on/off ink in points) or (None, None)
(2, N) array or two 1D arrays
drawstyleor ds{'default', 'steps', 'steps-pre', 'steps-mid', 'steps-post'}, default: 'default'
{'full', 'left', 'right', 'bottom', 'top', 'none'}
color or None
str
bool
object
linestyleor ls{'-', '--', '-.', ':', '', (offset, on-off-seq), ...}
linewidthor lwfloat
marker style string,
PathorMarkerStylemarkeredgecoloror meccolor
markeredgewidthor mewfloat
markerfacecoloror mfccolor
markerfacecoloraltor mfcaltcolor
markersizeor msfloat
None or int or (int, int) or slice or list[int] or float or (float, float) or list[bool]
bool
float or callable[[Artist, Event], tuple[bool, dict]]
unknown
bool
(scale: float, length: float, randomness: float)
bool or None
CapStyleor {'butt', 'projecting', 'round'}JoinStyleor {'miter', 'round', 'bevel'}unknown
str
bool
1D array
1D array
float
See also
Examples
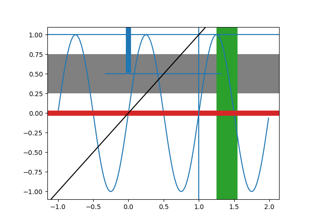
draw a thick red hline at 'y' = 0 that spans the xrange:
>>> axhline(linewidth=4, color='r')
draw a default hline at 'y' = 1 that spans the xrange:
>>> axhline(y=1)
draw a default hline at 'y' = .5 that spans the middle half of the xrange:
>>> axhline(y=.5, xmin=0.25, xmax=0.75)
Examples using matplotlib.axes.Axes.axhline#
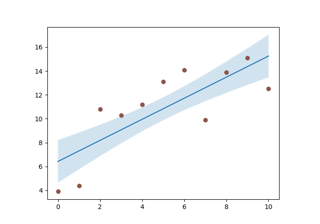
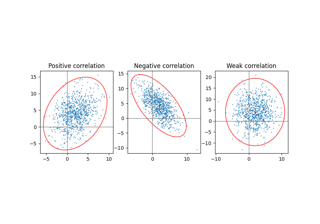
Plot a confidence ellipse of a two-dimensional dataset