matplotlib.axes.Axes.add_artist#
- Axes.add_artist(a)[source]#
Add an
Artistto the Axes; return the artist.Use
add_artistonly for artists for which there is no dedicated "add" method; and if necessary, use a method such asupdate_datalimto manually update the dataLim if the artist is to be included in autoscaling.If no
transformhas been specified when creating the artist (e.g.artist.get_transform() == None) then the transform is set toax.transData.
Examples using matplotlib.axes.Axes.add_artist#
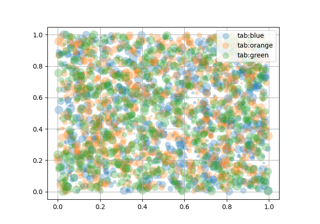
Scatter plots with a legend
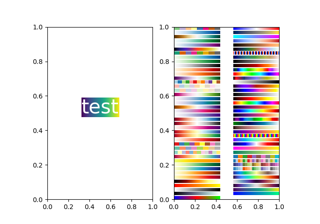
BboxImage Demo
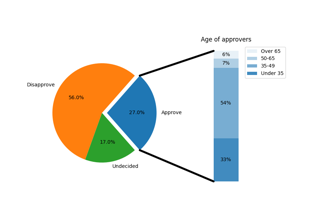
Bar of pie
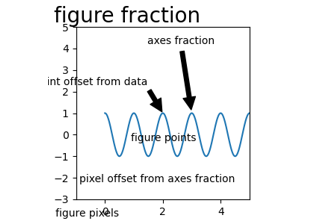
Annotating Plots
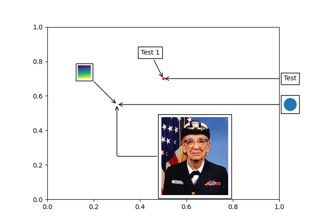
AnnotationBbox demo
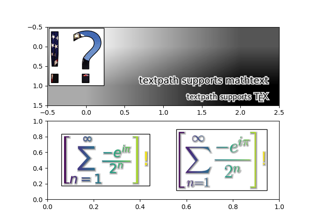
Using a text as a Path
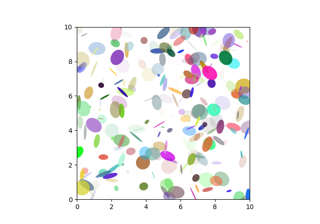
Ellipse Demo
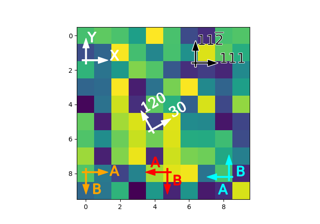
Anchored Direction Arrow
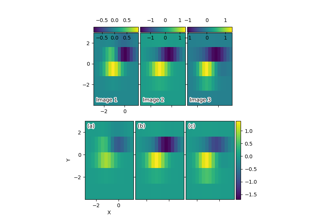
Axes Grid2
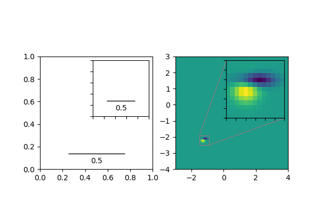
Inset Locator Demo2
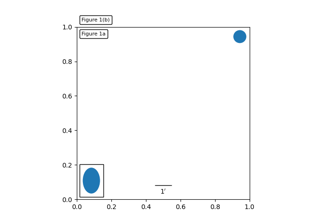
Simple Anchored Artists
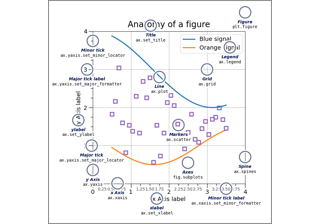
Anatomy of a figure
Anchored Artists
Artist tests
Anchored Box04
Annotate Explain
Connect Simple01
Simple Annotate01
Simple Legend02
Legend guide
Annotations
