matplotlib.axes.Axes.bxp#
- Axes.bxp(bxpstats, positions=None, widths=None, vert=True, patch_artist=False, shownotches=False, showmeans=False, showcaps=True, showbox=True, showfliers=True, boxprops=None, whiskerprops=None, flierprops=None, medianprops=None, capprops=None, meanprops=None, meanline=False, manage_ticks=True, zorder=None, capwidths=None)[source]#
Drawing function for box and whisker plots.
Make a box and whisker plot for each column of x or each vector in sequence x. The box extends from the lower to upper quartile values of the data, with a line at the median. The whiskers extend from the box to show the range of the data. Flier points are those past the end of the whiskers.
- Parameters:
- bxpstatslist of dicts
A list of dictionaries containing stats for each boxplot. Required keys are:
med: Median (scalar).q1,q3: First & third quartiles (scalars).whislo,whishi: Lower & upper whisker positions (scalars).
Optional keys are:
mean: Mean (scalar). Needed ifshowmeans=True.fliers: Data beyond the whiskers (array-like). Needed ifshowfliers=True.cilo,cihi: Lower & upper confidence intervals about the median. Needed ifshownotches=True.label: Name of the dataset (str). If available, this will be used a tick label for the boxplot
- positionsarray-like, default: [1, 2, ..., n]
The positions of the boxes. The ticks and limits are automatically set to match the positions.
- widthsfloat or array-like, default: None
The widths of the boxes. The default is
clip(0.15*(distance between extreme positions), 0.15, 0.5).- capwidthsfloat or array-like, default: None
Either a scalar or a vector and sets the width of each cap. The default is
0.5*(with of the box), see widths.- vertbool, default: True
If
True(default), makes the boxes vertical. IfFalse, makes horizontal boxes.- patch_artistbool, default: False
If
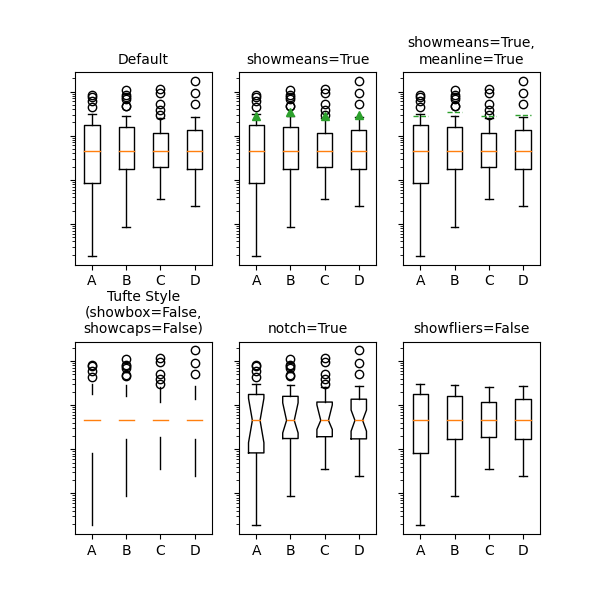
Falseproduces boxes with theLine2Dartist. IfTrueproduces boxes with thePatchartist.- shownotches, showmeans, showcaps, showbox, showfliersbool
Whether to draw the CI notches, the mean value (both default to False), the caps, the box, and the fliers (all three default to True).
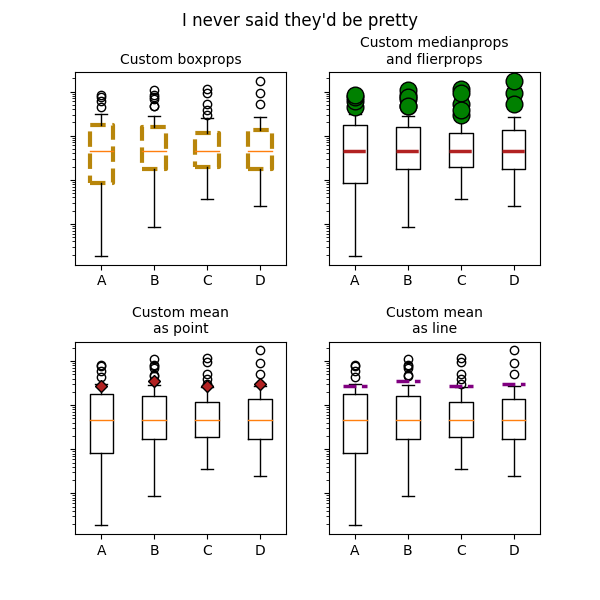
- boxprops, whiskerprops, capprops, flierprops, medianprops, meanpropsdict, optional
Artist properties for the boxes, whiskers, caps, fliers, medians, and means.
- meanlinebool, default: False
If
True(and showmeans isTrue), will try to render the mean as a line spanning the full width of the box according to meanprops. Not recommended if shownotches is also True. Otherwise, means will be shown as points.- manage_ticksbool, default: True
If True, the tick locations and labels will be adjusted to match the boxplot positions.
- zorderfloat, default:
Line2D.zorder = 2 The zorder of the resulting boxplot.
- Returns:
- dict
A dictionary mapping each component of the boxplot to a list of the
Line2Dinstances created. That dictionary has the following keys (assuming vertical boxplots):boxes: main bodies of the boxplot showing the quartiles, and the median's confidence intervals if enabled.medians: horizontal lines at the median of each box.whiskers: vertical lines up to the last non-outlier data.caps: horizontal lines at the ends of the whiskers.fliers: points representing data beyond the whiskers (fliers).means: points or lines representing the means.
Examples
(Source code, png)
(png)