matplotlib.axes.Axes.set_yticklabels#
- Axes.set_yticklabels(labels, *, fontdict=None, minor=False, **kwargs)[source]#
Set the yaxis' labels with list of string labels.
Warning
This method should only be used after fixing the tick positions using
Axes.set_yticks. Otherwise, the labels may end up in unexpected positions.- Parameters:
- labelslist of str
The label texts.
- fontdictdict, optional
A dictionary controlling the appearance of the ticklabels. The default fontdict is:
{'fontsize': rcParams['axes.titlesize'],
 'fontweight': rcParams['axes.titleweight'],
 'verticalalignment': 'baseline',
 'horizontalalignment': loc}
- minorbool, default: False
Whether to set the minor ticklabels rather than the major ones.
- Returns:
- list of
Text The labels.
- list of
- Other Parameters:
- **kwargs
Textproperties.
- **kwargs
Examples using matplotlib.axes.Axes.set_yticklabels#
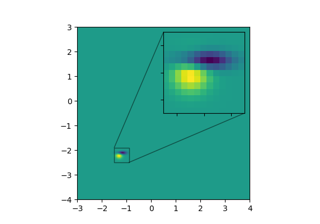
Zoom region inset axes
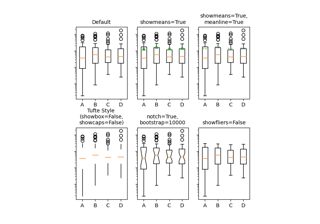
Artist customization in box plots
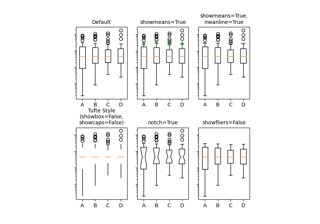
Artist customization in box plots
Boxplot drawer function
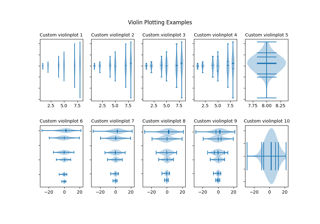
Violin plot basics
Rendering math equations using TeX
Rendering math equations using TeX
Colorbar Tick Labelling
Constrained Layout Guide
