matplotlib.axes.Axes.get_xaxis_transform#
- Axes.get_xaxis_transform(which='grid')[source]#
Get the transformation used for drawing x-axis labels, ticks and gridlines. The x-direction is in data coordinates and the y-direction is in axis coordinates.
Note
This transformation is primarily used by the
Axisclass, and is meant to be overridden by new kinds of projections that may need to place axis elements in different locations.
Examples using matplotlib.axes.Axes.get_xaxis_transform#
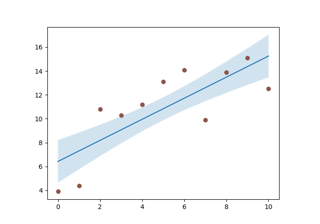
Filling the area between lines
Filling the area between lines
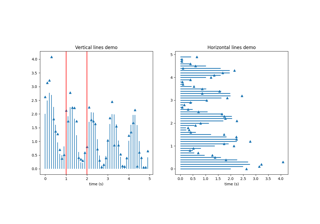
hlines and vlines
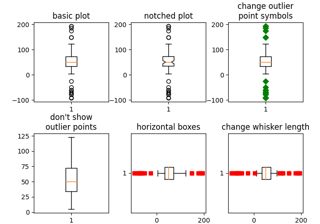
Boxplots
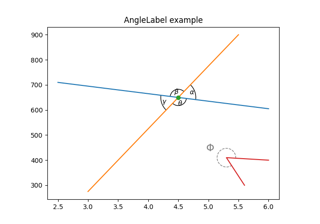
Scale invariant angle label
Centered spines with arrows
Transformations Tutorial
