Note
Click here to download the full example code
Mathtext#
Use Matplotlib's internal LaTeX parser and layout engine. For true LaTeX rendering, see the text.usetex option.
import matplotlib.pyplot as plt

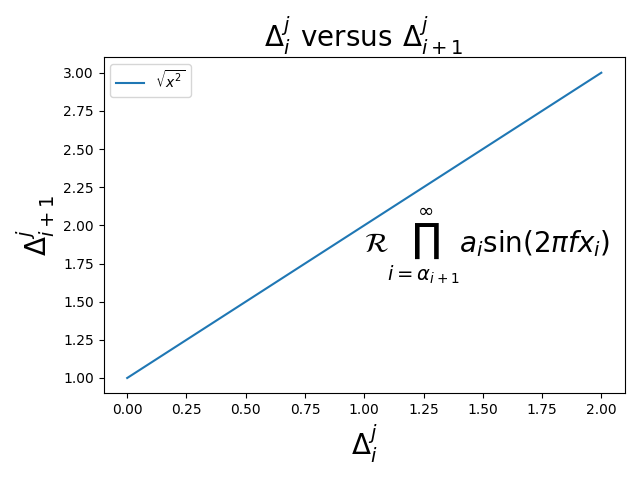
fig, ax = plt.subplots()

ax.plot([1, 2, 3], label=r'$\sqrt{x^2}$')
ax.legend()

ax.set_xlabel(r'$\Delta_i^j$', fontsize=20)
ax.set_ylabel(r'$\Delta_{i+1}^j$', fontsize=20)
ax.set_title(r'$\Delta_i^j \hspace{0.4} \mathrm{versus} \hspace{0.4} '
             r'\Delta_{i+1}^j$', fontsize=20)

tex = r'$\mathcal{R}\prod_{i=\alpha_{i+1}}^\infty a_i\sin(2 \pi f x_i)$'
ax.text(1, 1.6, tex, fontsize=20, va='bottom')

fig.tight_layout()
plt.show()
