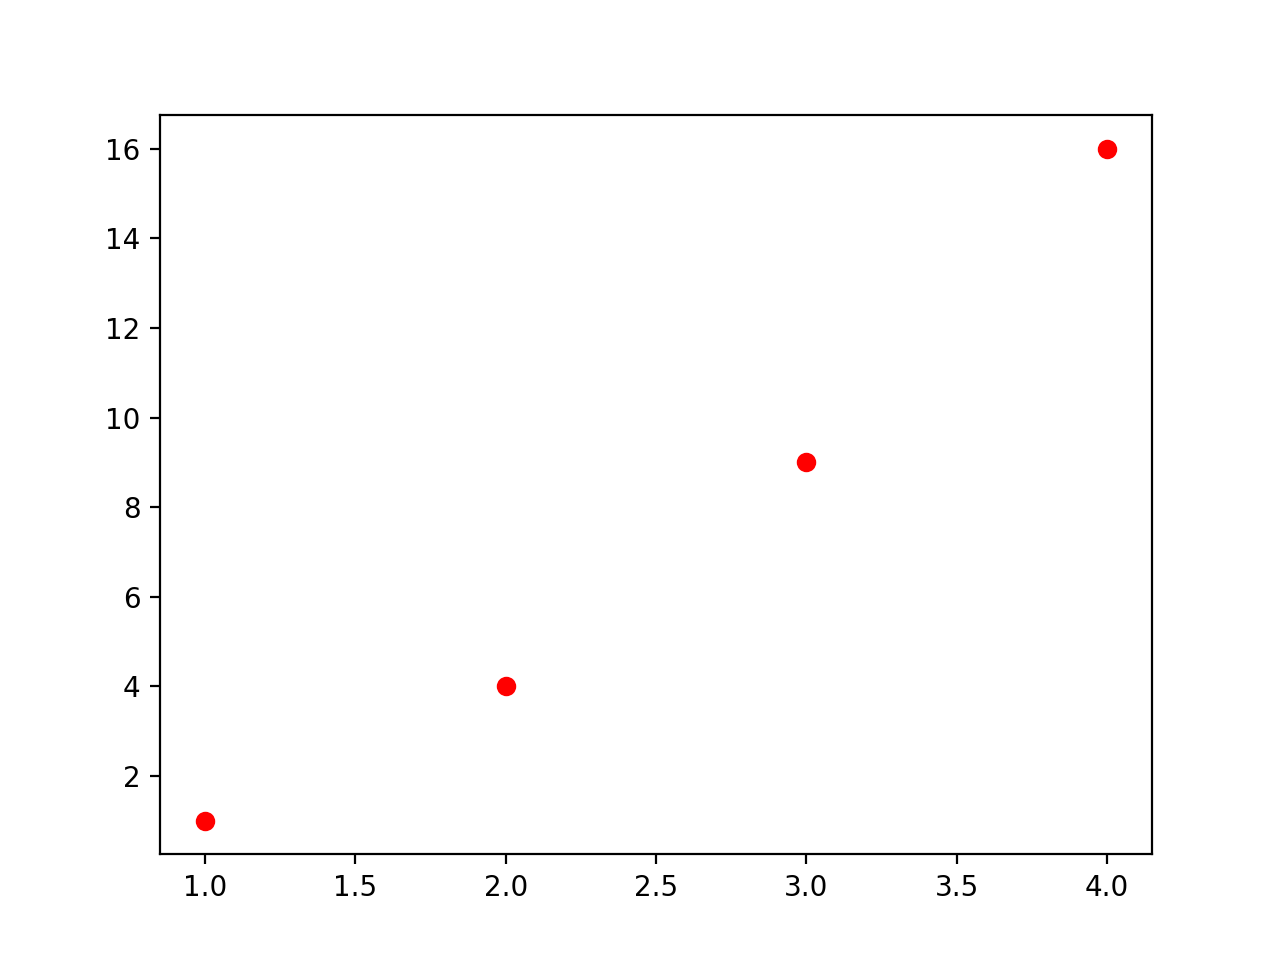
Note Click here to download the full example code plot() format string# Use a format string (here, 'ro') to set the color and markers of a plot. import matplotlib.pyplot as plt plt.plot([1, 2, 3, 4], [1, 4, 9, 16], 'ro') plt.show() References The use of the following functions, methods, classes and modules is shown in this example: matplotlib.axes.Axes.plot / matplotlib.pyplot.plot Gallery generated by Sphinx-Gallery