Note
Click here to download the full example code
Scatter plots with custom symbols#
Using TeX symbols#
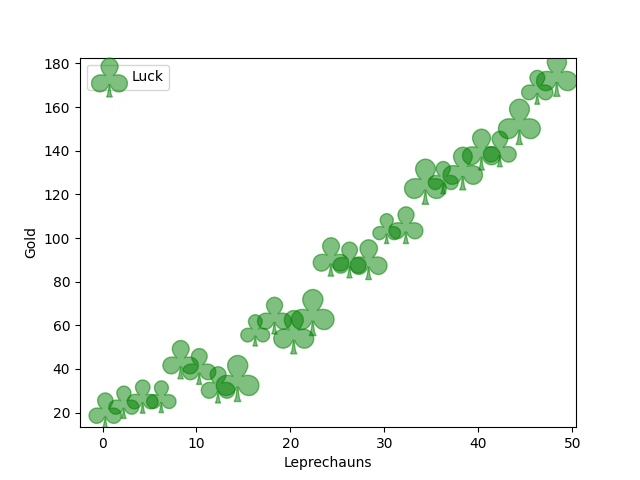
An easy way to customize scatter symbols is passing a TeX symbol name
enclosed in $-signs as a marker. Below we use marker=r'$\clubsuit$'.
import matplotlib.pyplot as plt
import numpy as np

# Fixing random state for reproducibility
np.random.seed(19680801)


x = np.arange(0.0, 50.0, 2.0)
y = x ** 1.3 + np.random.rand(*x.shape) * 30.0
sizes = np.random.rand(*x.shape) * 800 + 500

fig, ax = plt.subplots()
ax.scatter(x, y, sizes, c="green", alpha=0.5, marker=r'$\clubsuit$',
           label="Luck")
ax.set_xlabel("Leprechauns")
ax.set_ylabel("Gold")
ax.legend()
plt.show()
Using a custom path#
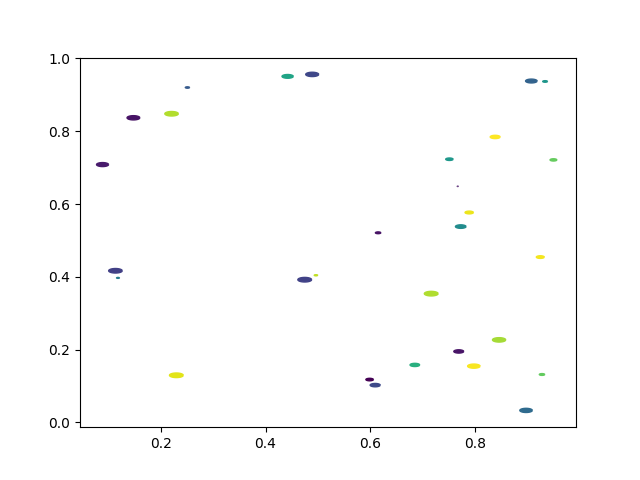
Alternatively, one can also pass a custom path of N vertices as a Nx2 array of x, y values as marker.
# unit area ellipse
rx, ry = 3., 1.
area = rx * ry * np.pi
theta = np.arange(0, 2 * np.pi + 0.01, 0.1)
verts = np.column_stack([rx / area * np.cos(theta), ry / area * np.sin(theta)])

x, y, s, c = np.random.rand(4, 30)
s *= 10**2.

fig, ax = plt.subplots()
ax.scatter(x, y, s, c, marker=verts)

plt.show()

