3D plotting#
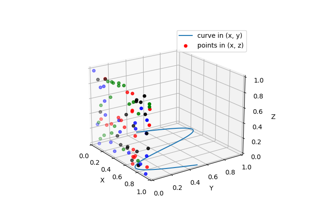
Plot 2D data on 3D plot
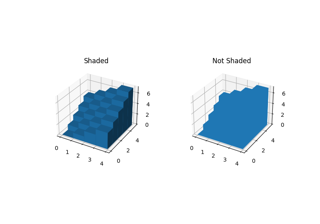
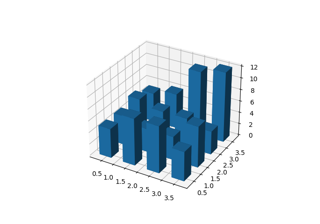
Demo of 3D bar charts
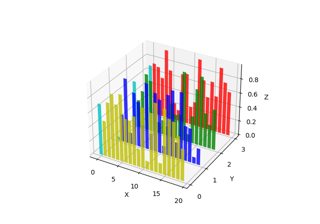
Create 2D bar graphs in different planes
Create 2D bar graphs in different planes
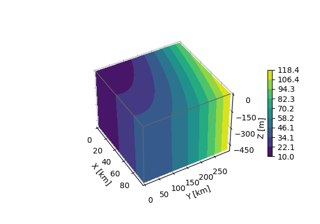
3D box surface plot
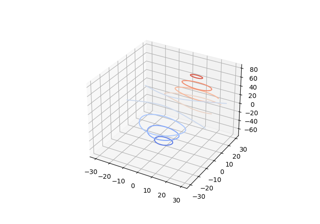
Demonstrates plotting contour (level) curves in 3D
Demonstrates plotting contour (level) curves in 3D
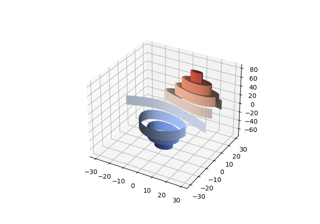
Demonstrates plotting contour (level) curves in 3D using the extend3d option
Demonstrates plotting contour (level) curves in 3D using the extend3d option
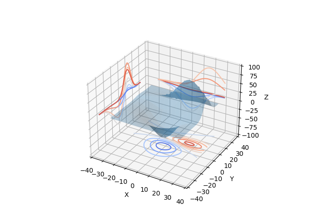
Projecting contour profiles onto a graph
Projecting contour profiles onto a graph
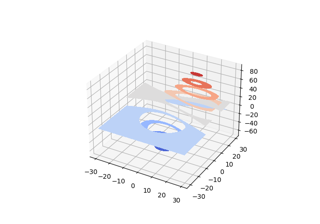
Filled contours
Projecting filled contour onto a graph
Projecting filled contour onto a graph
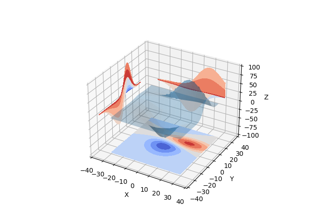
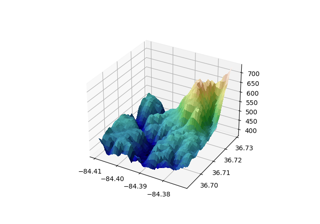
Custom hillshading in a 3D surface plot
Custom hillshading in a 3D surface plot
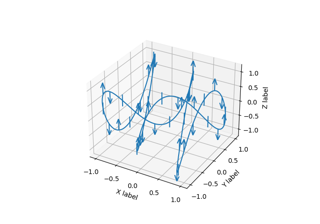
3D errorbars
Create 3D histogram of 2D data
Create 3D histogram of 2D data
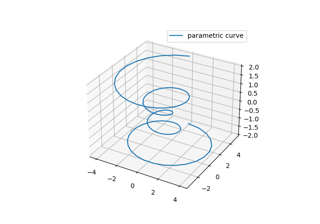
Parametric Curve
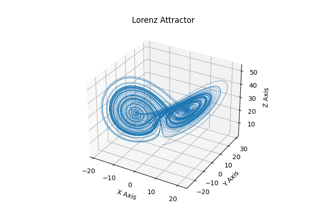
Lorenz Attractor
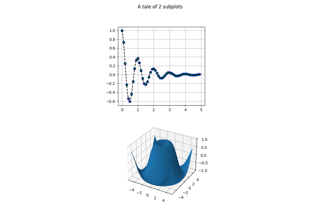
2D and 3D *Axes* in same *Figure*
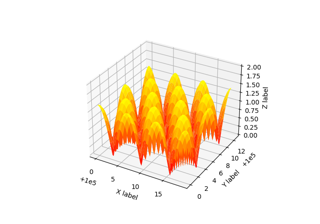
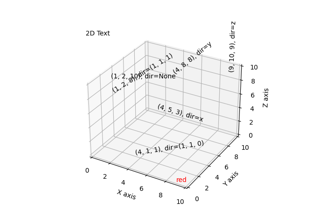
Automatic Text Offsetting
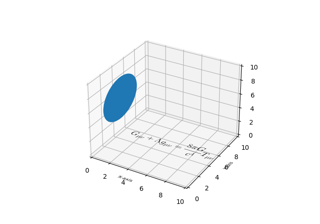
Draw flat objects in 3D plot
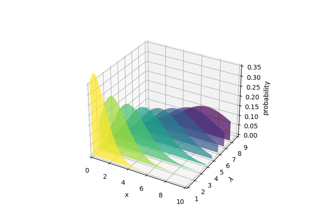
Generate polygons to fill under 3D line graph
Generate polygons to fill under 3D line graph
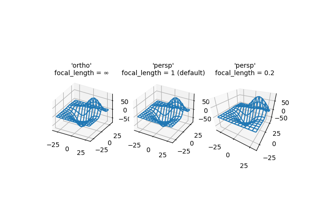
3D plot projection types
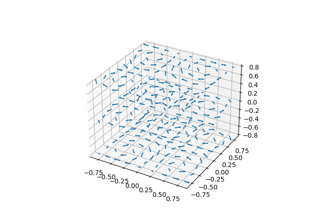
3D quiver plot
Rotating a 3D plot
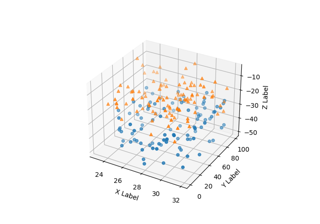
3D scatterplot
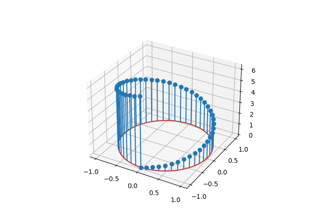
3D stem
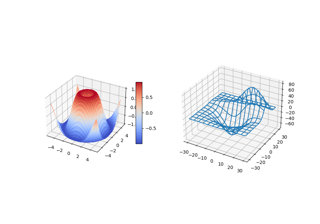
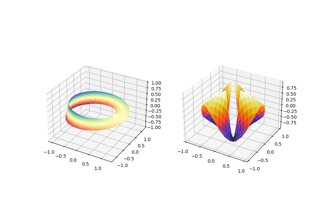
3D plots as subplots
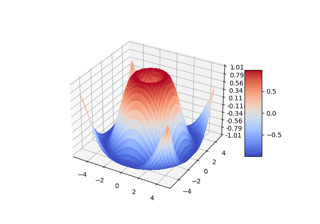
3D surface (colormap)
3D surface (solid color)
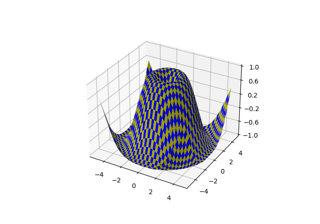
3D surface (checkerboard)
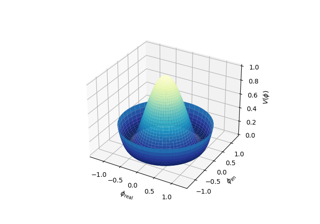
3D surface with polar coordinates
3D surface with polar coordinates
Text annotations in 3D
Triangular 3D contour plot
Triangular 3D filled contour plot
Triangular 3D filled contour plot
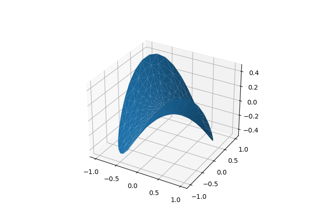
Triangular 3D surfaces
More triangular 3D surfaces
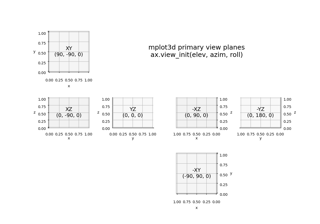
Primary 3D view planes
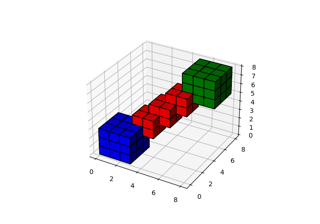
3D voxel / volumetric plot
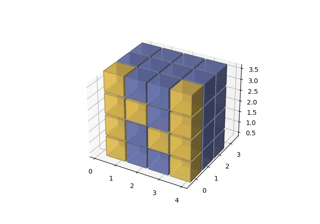
3D voxel plot of the numpy logo
3D voxel plot of the numpy logo
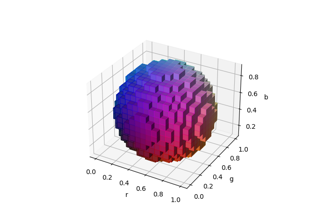
3D voxel / volumetric plot with rgb colors
3D voxel / volumetric plot with rgb colors
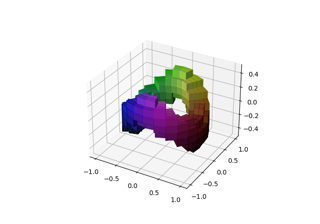
3D voxel / volumetric plot with cylindrical coordinates
3D voxel / volumetric plot with cylindrical coordinates
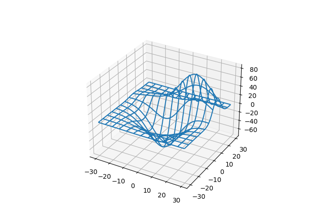
3D wireframe plot
Animating a 3D wireframe plot
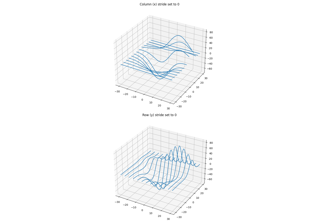
3D wireframe plots in one direction
3D wireframe plots in one direction
