Ctrl+K
Logo image Logo image
  • Plot types
  • Examples
  • Tutorials
  • API Reference
  • Users guide
  • Contributing
  • Plot types
  • Examples
  • Tutorials
  • Reference
  • User guide
  • Develop
  • Release notes

Section Navigation

  • Lines, bars and markers
    • Bar color demo
    • Bar Label Demo
    • Stacked bar chart
    • Grouped bar chart with labels
    • Horizontal bar chart
    • Broken Barh
    • CapStyle
    • Plotting categorical variables
    • Plotting the coherence of two signals
    • CSD Demo
    • Curve with error band
    • Errorbar limit selection
    • Errorbar subsampling
    • EventCollection Demo
    • Eventplot Demo
    • Filled polygon
    • Fill Between and Alpha
    • Filling the area between lines
    • Fill Betweenx Demo
    • Hatch-filled histograms
    • Bar chart with gradients
    • Hat graph
    • Discrete distribution as horizontal bar chart
    • JoinStyle
    • Customizing dashed line styles
    • Lines with a ticked patheffect
    • Linestyles
    • Marker reference
    • Markevery Demo
    • Plotting masked and NaN values
    • Multicolored lines
    • Mapping marker properties to multivariate data
    • Psd Demo
    • Scatter plots with custom symbols
    • Scatter Demo2
    • Scatter plot with histograms
    • Scatter Masked
    • Marker examples
    • Scatter plots with a legend
    • Simple Plot
    • Using span_where
    • Spectrum Representations
    • Stackplots and streamgraphs
    • Stairs Demo
    • Stem Plot
    • Step Demo
    • Creating a timeline with lines, dates, and text
    • hlines and vlines
    • Cross- and Auto-Correlation Demo
  • Images, contours and fields
    • Affine transform of an image
    • Wind Barbs
    • Barcode
    • Interactive Adjustment of Colormap Range
    • Colormap Normalizations
    • Colormap Normalizations SymLogNorm
    • Contour Corner Mask
    • Contour Demo
    • Contour Image
    • Contour Label Demo
    • Contourf Demo
    • Contourf Hatching
    • Contourf and log color scale
    • Contouring the solution space of optimizations
    • BboxImage Demo
    • Figimage Demo
    • Creating annotated heatmaps
    • Image antialiasing
    • Clipping images with patches
    • Image Demo
    • Image Masked
    • Image Nonuniform
    • Blend transparency with color in 2D images
    • Modifying the coordinate formatter
    • Interpolations for imshow
    • Contour plot of irregularly spaced data
    • Layer Images
    • Matshow
    • Multi Image
    • Pcolor Demo
    • pcolormesh grids and shading
    • pcolormesh
    • Streamplot
    • QuadMesh Demo
    • Advanced quiver and quiverkey functions
    • Quiver Simple Demo
    • Shading example
    • Spectrogram Demo
    • Spy Demos
    • Tricontour Demo
    • Tricontour Smooth Delaunay
    • Tricontour Smooth User
    • Trigradient Demo
    • Triinterp Demo
    • Tripcolor Demo
    • Triplot Demo
    • Watermark image
  • Subplots, axes and figures
    • Aligning Labels
    • Axes box aspect
    • Axes Demo
    • Controlling view limits using margins and sticky_edges
    • Axes Props
    • Axes Zoom Effect
    • axhspan Demo
    • Equal axis aspect ratio
    • Axis Label Position
    • Broken Axis
    • Placing Colorbars
    • Custom Figure subclasses
    • Resizing axes with constrained layout
    • Resizing axes with tight layout
    • Different scales on the same axes
    • Figure size in different units
    • Figure labels: suptitle, supxlabel, supylabel
    • Creating adjacent subplots
    • Geographic Projections
    • Combining two subplots using subplots and GridSpec
    • Using Gridspec to make multi-column/row subplot layouts
    • Nested Gridspecs
    • Invert Axes
    • Managing multiple figures in pyplot
    • Secondary Axis
    • Sharing axis limits and views
    • Shared Axis
    • Figure subfigures
    • Multiple subplots
    • Subplots spacings and margins
    • Creating multiple subplots using plt.subplots
    • Plots with different scales
    • Zoom region inset axes
  • Statistics
    • Percentiles as horizontal bar chart
    • Artist customization in box plots
    • Box plots with custom fill colors
    • Boxplots
    • Box plot vs. violin plot comparison
    • Boxplot drawer function
    • Plot a confidence ellipse of a two-dimensional dataset
    • Violin plot customization
    • Errorbar function
    • Different ways of specifying error bars
    • Including upper and lower limits in error bars
    • Creating boxes from error bars using PatchCollection
    • Hexagonal binned plot
    • Histograms
    • Using histograms to plot a cumulative distribution
    • Some features of the histogram (hist) function
    • Demo of the histogram function's different histtype settings
    • The histogram (hist) function with multiple data sets
    • Producing multiple histograms side by side
    • Time Series Histogram
    • Violin plot basics
  • Pie and polar charts
    • Basic pie chart
    • Pie Demo2
    • Bar of pie
    • Nested pie charts
    • Labeling a pie and a donut
    • Bar chart on polar axis
    • Polar plot
    • Polar Legend
    • Scatter plot on polar axis
  • Text, labels and annotations
    • Using accented text in Matplotlib
    • Scale invariant angle label
    • Annotating Plots
    • Arrow Demo
    • Auto-wrapping text
    • Composing Custom Legends
    • Date tick labels
    • AnnotationBbox demo
    • Using a text as a Path
    • Text Rotation Mode
    • The difference between \dfrac and \frac
    • Labeling ticks using engineering notation
    • Annotation arrow style reference
    • Styling text boxes
    • Figure legend demo
    • Configuring the font family
    • Using a ttf font file in Matplotlib
    • Font table
    • Fonts demo (object-oriented style)
    • Fonts demo (keyword arguments)
    • Labelling subplots
    • Legend using pre-defined labels
    • Legend Demo
    • Artist within an artist
    • Convert texts to images
    • Mathtext
    • Mathtext Examples
    • Math fontfamily
    • Multiline
    • Placing text boxes
    • Rainbow text
    • STIX Fonts
    • Rendering math equations using TeX
    • Text alignment
    • Controlling style of text and labels using a dictionary
    • Default text rotation demonstration
    • Text Rotation Relative To Line
    • Title positioning
    • Unicode minus
    • Usetex Baseline Test
    • Usetex Fonteffects
    • Text watermark
  • pyplot
    • Align y-labels
    • Annotate Transform
    • Annotating a plot
    • Annotation Polar
    • Programmatically controlling subplot adjustment
    • Infinite lines
    • Boxplot Demo
    • Dollar Ticks
    • Fig Axes Customize Simple
    • Simple axes labels
    • Adding lines to figures
    • plot() format string
    • Pyplot Mathtext
    • Pyplot Simple
    • Pyplot Text
    • Pyplot Three
    • Pyplot Two Subplots
    • Text Commands
    • Text Layout
  • Color
    • Color Demo
    • Color by y-value
    • Colors in the default property cycle
    • Colorbar
    • Colormap reference
    • Creating a colormap from a list of colors
    • List of named colors
  • Shapes and collections
    • Arrow guide
    • Reference for Matplotlib artists
    • Line, Poly and RegularPoly Collection with autoscaling
    • Compound path
    • Dolphins
    • Mmh Donuts!!!
    • Ellipse Collection
    • Ellipse Demo
    • Drawing fancy boxes
    • Hatch demo
    • Hatch style reference
    • Line Collection
    • Circles, Wedges and Polygons
    • PathPatch object
    • Bezier Curve
    • Scatter plot
  • Style sheets
    • Bayesian Methods for Hackers style sheet
    • Dark background style sheet
    • FiveThirtyEight style sheet
    • ggplot style sheet
    • Grayscale style sheet
    • Solarized Light stylesheet
    • Style sheets reference
  • axes_grid1
    • Anchored Direction Arrow
    • Axes Divider
    • Demo Axes Grid
    • Axes Grid2
    • HBoxDivider demo
    • Showing RGB channels using RGBAxes
    • Adding a colorbar to inset axes
    • Colorbar with AxesDivider
    • Controlling the position and size of colorbars with Inset Axes
    • Per-row or per-column colorbars
    • Axes with a fixed physical size
    • Setting a fixed aspect on ImageGrid cells
    • Inset Locator Demo
    • Inset Locator Demo2
    • Make room for ylabel using axes_grid
    • Parasite Simple
    • Parasite Simple2
    • Scatter Histogram (Locatable Axes)
    • Simple Anchored Artists
    • Simple Axes Divider 1
    • Simple Axes Divider 3
    • Simple ImageGrid
    • Simple ImageGrid 2
    • Simple Axisline4
    • Simple Colorbar
  • axisartist
    • Axis Direction
    • axis_direction demo
    • Axis line styles
    • Curvilinear grid demo
    • Demo CurveLinear Grid2
    • mpl_toolkits.axisartist.floating_axes features
    • floating_axis demo
    • Parasite Axes demo
    • Parasite axis demo
    • Ticklabel alignment
    • Ticklabel direction
    • Simple Axis Direction01
    • Simple Axis Direction03
    • Simple Axis Pad
    • Custom spines with axisartist
    • Simple Axisline
    • Simple Axisline3
  • Showcase
    • Anatomy of a figure
    • Firefox
    • Integral as the area under a curve
    • Shaded & power normalized rendering
    • Stock prices over 32 years
    • XKCD
  • Animation
    • Decay
    • Animated histogram
    • pyplot animation
    • The Bayes update
    • The double pendulum problem
    • Animated image using a precomputed list of images
    • Frame grabbing
    • Pausing and Resuming an Animation
    • Rain simulation
    • Animated 3D random walk
    • Animated line plot
    • Oscilloscope
    • MATPLOTLIB UNCHAINED
    • Decay
    • The Bayes update
    • The double pendulum problem
    • Animated histogram
    • Rain simulation
    • Animated 3D random walk
    • Animated line plot
    • Oscilloscope
    • MATPLOTLIB UNCHAINED
    • Animated image using a precomputed list of images
    • Frame grabbing
  • Event handling
    • Close Event
    • Mouse move and click events
    • Cross hair cursor
    • Data Browser
    • Figure/Axes enter and leave events
    • Interactive functions
    • Image Slices Viewer
    • Keypress event
    • Lasso Demo
    • Legend Picking
    • Looking Glass
    • Path Editor
    • Pick Event Demo
    • Pick Event Demo2
    • Poly Editor
    • Pong
    • Resampling Data
    • Timers
    • Trifinder Event Demo
    • Viewlims
    • Zoom Window
  • Miscellaneous
    • Anchored Artists
    • Changing colors of lines intersecting a box
    • Manual Contour
    • Coords Report
    • Custom projection
    • Customize Rc
    • AGG filter
    • Ribbon Box
    • Fill Spiral
    • Findobj Demo
    • Font indexing
    • Font properties
    • Building histograms using Rectangles and PolyCollections
    • Hyperlinks
    • Image Thumbnail
    • Plotting with keywords
    • Matplotlib logo
    • Multipage PDF
    • Multiprocess
    • Packed-bubble chart
    • Patheffect Demo
    • Print Stdout
    • Pythonic Matplotlib
    • Rasterization for vector graphics
    • Set and get properties
    • SVG Filter Line
    • SVG Filter Pie
    • Table Demo
    • TickedStroke patheffect
    • transforms.offset_copy
    • Zorder Demo
  • 3D plotting
    • Plot 2D data on 3D plot
    • Demo of 3D bar charts
    • Create 2D bar graphs in different planes
    • 3D box surface plot
    • Demonstrates plotting contour (level) curves in 3D
    • Demonstrates plotting contour (level) curves in 3D using the extend3d option
    • Projecting contour profiles onto a graph
    • Filled contours
    • Projecting filled contour onto a graph
    • Custom hillshading in a 3D surface plot
    • 3D errorbars
    • Create 3D histogram of 2D data
    • Parametric Curve
    • Lorenz Attractor
    • 2D and 3D Axes in same Figure
    • Automatic Text Offsetting
    • Draw flat objects in 3D plot
    • Generate polygons to fill under 3D line graph
    • 3D plot projection types
    • 3D quiver plot
    • Rotating a 3D plot
    • 3D scatterplot
    • 3D stem
    • 3D plots as subplots
    • 3D surface (colormap)
    • 3D surface (solid color)
    • 3D surface (checkerboard)
    • 3D surface with polar coordinates
    • Text annotations in 3D
    • Triangular 3D contour plot
    • Triangular 3D filled contour plot
    • Triangular 3D surfaces
    • More triangular 3D surfaces
    • Primary 3D view planes
    • 3D voxel / volumetric plot
    • 3D voxel plot of the numpy logo
    • 3D voxel / volumetric plot with rgb colors
    • 3D voxel / volumetric plot with cylindrical coordinates
    • 3D wireframe plot
    • Animating a 3D wireframe plot
    • 3D wireframe plots in one direction
  • Scales
    • Asinh Demo
    • Loglog Aspect
    • Custom scale
    • Log Bar
    • Log Demo
    • Logit Demo
    • Exploring normalizations
    • Scales
    • Log Axis
    • Symlog Demo
  • Specialty Plots
    • Hillshading
    • Anscombe's quartet
    • Hinton diagrams
    • Left ventricle bullseye
    • MRI
    • MRI with EEG
    • Radar chart (aka spider or star chart)
    • The Sankey class
    • Long chain of connections using Sankey
    • Rankine power cycle
    • SkewT-logP diagram: using transforms and custom projections
    • Topographic hillshading
  • Spines
    • Centered spines with arrows
    • Multiple Yaxis With Spines
    • Spine Placement
    • Spines
    • Custom spine bounds
    • Dropped spines
  • Ticks
    • Automatically setting tick positions
    • Centering labels between ticks
    • Colorbar Tick Labelling
    • Custom Ticker
    • Formatting date ticks using ConciseDateFormatter
    • Date Demo Convert
    • Placing date ticks using recurrence rules
    • Date tick locators and formatters
    • Custom tick formatter for time series
    • Date Precision and Epochs
    • Major and minor ticks
    • The default tick formatter
    • Tick formatters
    • Tick locators
    • Set default y-axis tick labels on the right
    • Setting tick labels from a list of values
    • Move x-axis tick labels to the top
    • Rotating custom tick labels
    • Fixing too many ticks
  • Units
    • Annotation with units
    • Artist tests
    • Bar demo with units
    • Group barchart with units
    • Basic Units
    • Ellipse with units
    • Evans test
    • Radian ticks
    • Inches and Centimeters
    • Unit handling
  • Embedding Matplotlib in graphical user interfaces
    • CanvasAgg demo
    • Embedding in GTK3 with a navigation toolbar
    • Embedding in GTK3
    • Embedding in GTK4 with a navigation toolbar
    • Embedding in GTK4
    • Embedding in Qt
    • Embedding in Tk
    • Embedding in wx #2
    • Embedding in wx #3
    • Embedding in wx #4
    • Embedding in wx #5
    • Embedding WebAgg
    • Fourier Demo WX
    • GTK3 Spreadsheet
    • GTK4 Spreadsheet
    • MathText WX
    • Matplotlib with Glade 3
    • pyplot with GTK3
    • pyplot with GTK4
    • SVG Histogram
    • SVG Tooltip
    • Tool Manager
    • Embedding in a web application server (Flask)
    • Adding a cursor in WX
  • Userdemo
    • Anchored Box04
    • Annotate Explain
    • Annotate Simple01
    • Annotate Simple02
    • Annotate Simple03
    • Annotate Simple04
    • Annotate Simple Coord01
    • Annotate Simple Coord02
    • Annotate Simple Coord03
    • Annotate Text Arrow
    • Connect Simple01
    • Connection styles for annotations
    • Custom box styles
    • subplot2grid demo
    • GridSpec demo
    • Nested GridSpecs
    • PGF fonts
    • PGF preamble
    • PGF texsystem
    • Simple Annotate01
    • Simple Legend01
    • Simple Legend02
  • Widgets
    • Annotated Cursor
    • Buttons
    • Check Buttons
    • Cursor
    • Lasso Selector
    • Menu
    • Mouse Cursor
    • Multicursor
    • Select indices from a collection using polygon selector
    • Polygon Selector
    • Radio Buttons
    • Thresholding an Image with RangeSlider
    • Rectangle and ellipse selectors
    • Slider
    • Snapping Sliders to Discrete Values
    • Span Selector
    • Textbox
  • Color

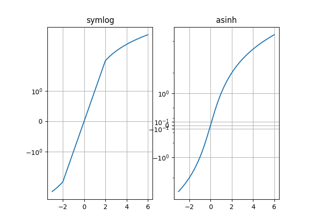
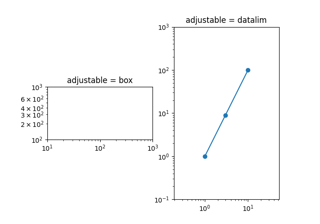
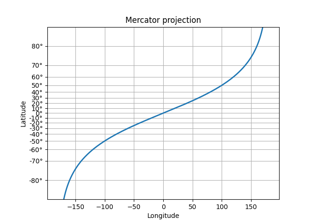
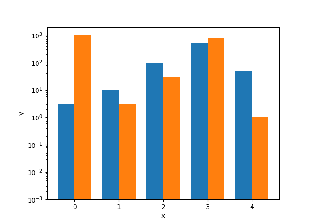
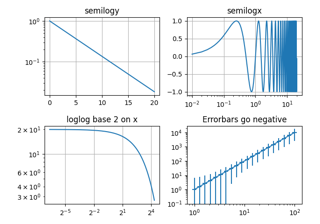
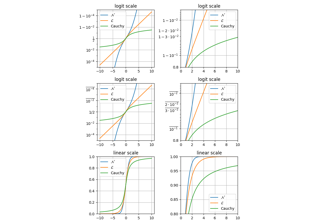
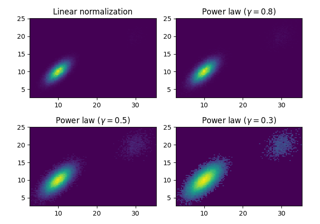
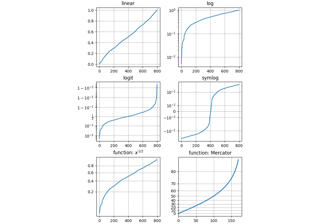
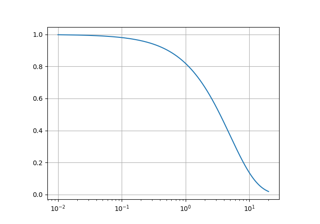
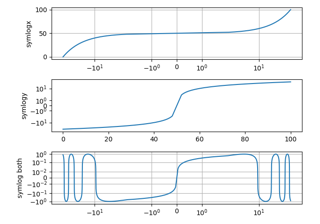
Scales#

These examples cover how different scales are handled in Matplotlib.

Asinh Demo

Asinh Demo

Asinh Demo
Loglog Aspect

Loglog Aspect

Loglog Aspect
Custom scale

Custom scale

Custom scale
Log Bar

Log Bar

Log Bar
Log Demo

Log Demo

Log Demo
Logit Demo

Logit Demo

Logit Demo
Exploring normalizations

Exploring normalizations

Exploring normalizations
Scales

Scales

Scales
Log Axis

Log Axis

Log Axis
Symlog Demo

Symlog Demo

Symlog Demo
Show Source

© Copyright 2002–2012 John Hunter, Darren Dale, Eric Firing, Michael Droettboom and the Matplotlib development team; 2012–2022 The Matplotlib development team.

Created using Sphinx 5.1.1.