Statistics#
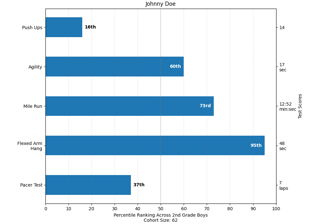
Percentiles as horizontal bar chart
Percentiles as horizontal bar chart
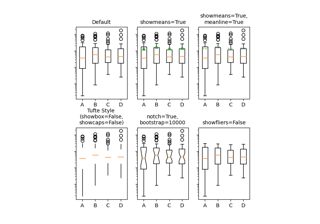
Artist customization in box plots
Artist customization in box plots
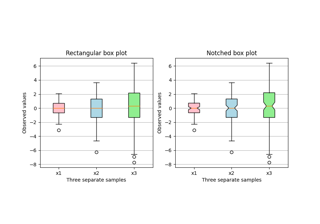
Box plots with custom fill colors
Box plots with custom fill colors
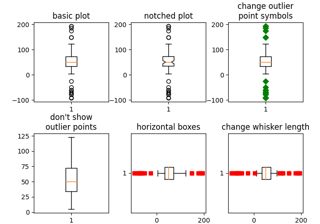
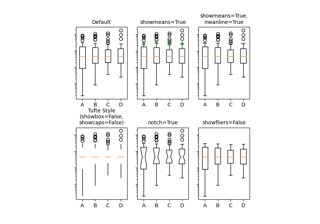
Boxplots
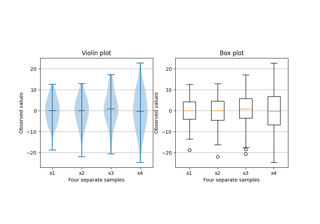
Box plot vs. violin plot comparison
Box plot vs. violin plot comparison
Boxplot drawer function
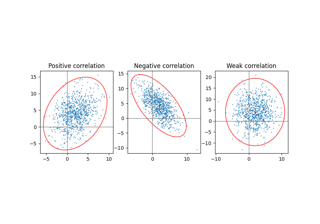
Plot a confidence ellipse of a two-dimensional dataset
Plot a confidence ellipse of a two-dimensional dataset
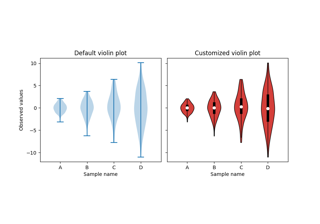
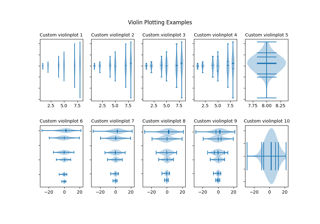
Violin plot customization
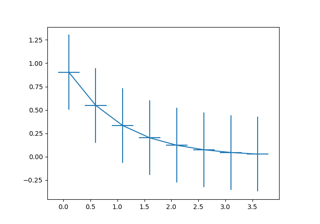
Errorbar function
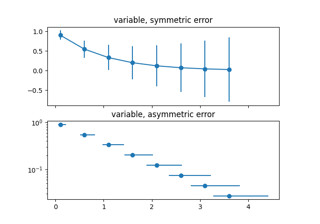
Different ways of specifying error bars
Different ways of specifying error bars
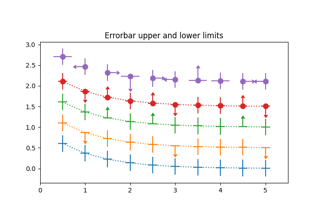
Including upper and lower limits in error bars
Including upper and lower limits in error bars
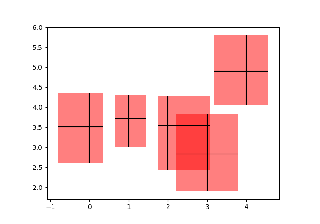
Creating boxes from error bars using PatchCollection
Creating boxes from error bars using PatchCollection
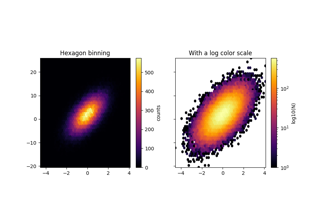
Hexagonal binned plot
Histograms
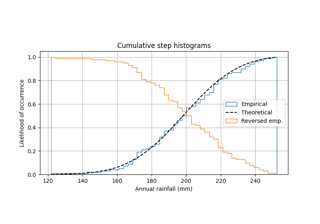
Using histograms to plot a cumulative distribution
Using histograms to plot a cumulative distribution
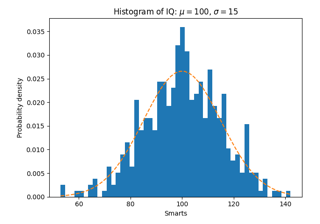
Some features of the histogram (hist) function
Some features of the histogram (hist) function
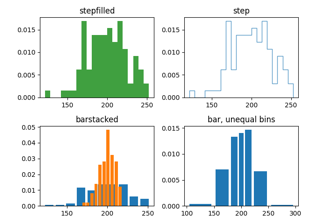
Demo of the histogram function's different histtype settings
Demo of the histogram function's different ``histtype`` settings
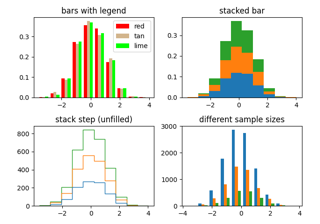
The histogram (hist) function with multiple data sets
The histogram (hist) function with multiple data sets
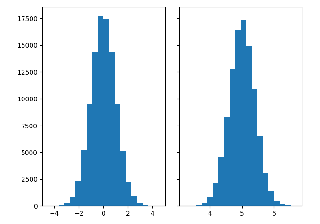
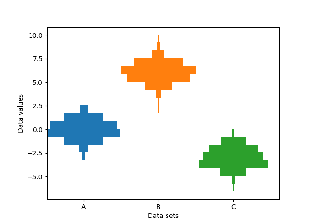
Producing multiple histograms side by side
Producing multiple histograms side by side
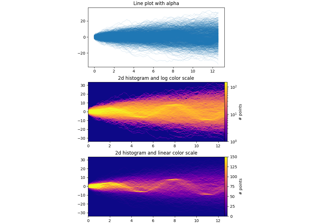
Time Series Histogram
Violin plot basics
