Note
Click here to download the full example code
The mplot3d Toolkit#
Generating 3D plots using the mplot3d toolkit.
This tutorial showcases various 3D plots. Click on the figures to see each full gallery example with the code that generates the figures.
3D Axes (of class Axes3D) are created by passing the projection="3d"
keyword argument to Figure.add_subplot:
import matplotlib.pyplot as plt
fig = plt.figure()
ax = fig.add_subplot(projection='3d')
Multiple 3D subplots can be added on the same figure, as for 2D subplots.
Changed in version 1.0.0: Prior to Matplotlib 1.0.0, only a single Axes3D could be created per
figure; it needed to be directly instantiated as ax = Axes3D(fig).
Changed in version 3.2.0: Prior to Matplotlib 3.2.0, it was necessary to explicitly import the
mpl_toolkits.mplot3d module to make the '3d' projection to
Figure.add_subplot.
See the mplot3d FAQ for more information about the mplot3d toolkit.
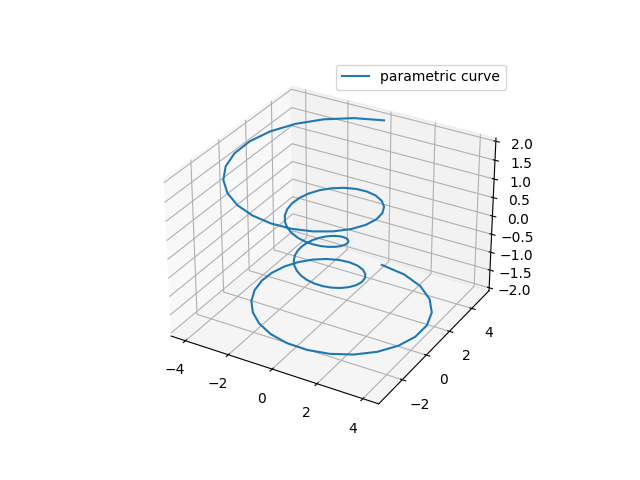
Line plots#
See Axes3D.plot for API documentation.
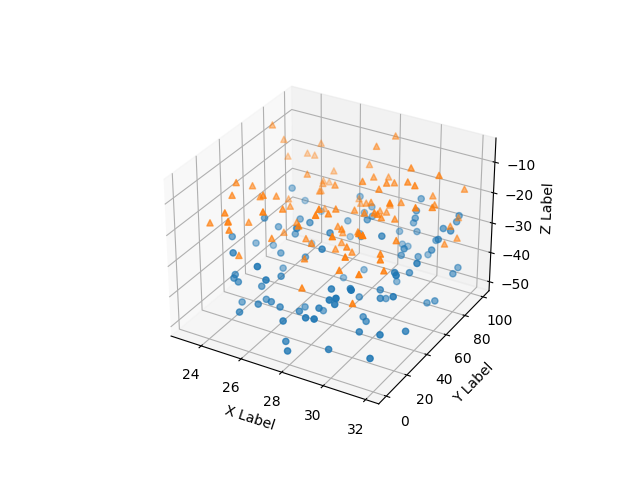
Scatter plots#
See Axes3D.scatter for API documentation.
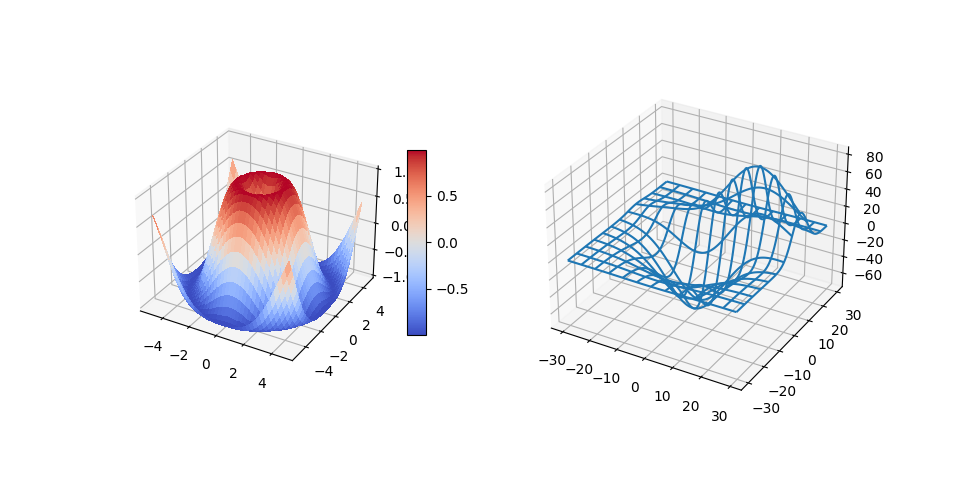
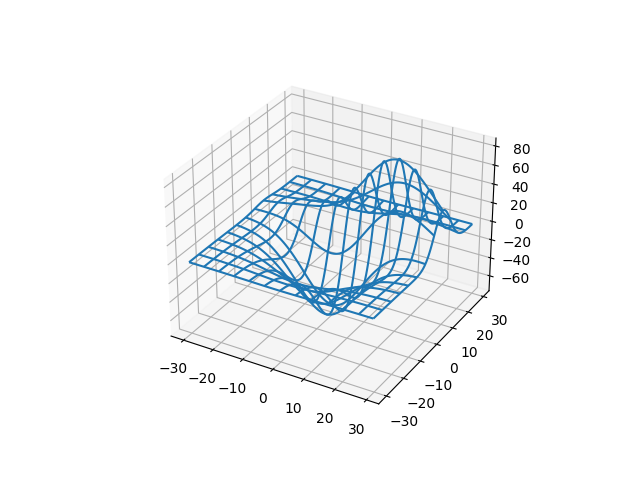
Wireframe plots#
See Axes3D.plot_wireframe for API documentation.
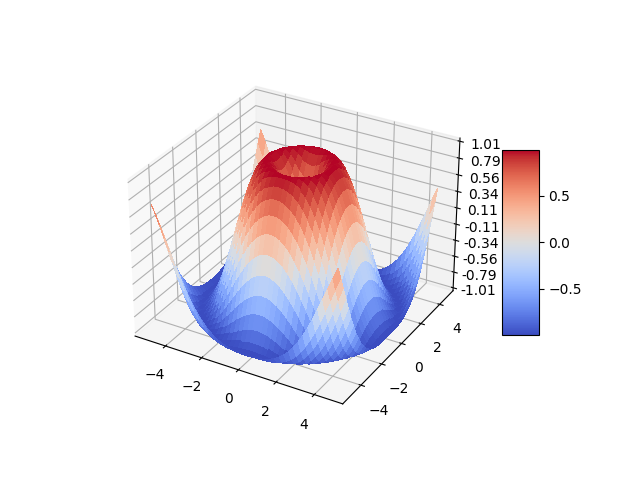
Surface plots#
See Axes3D.plot_surface for API documentation.
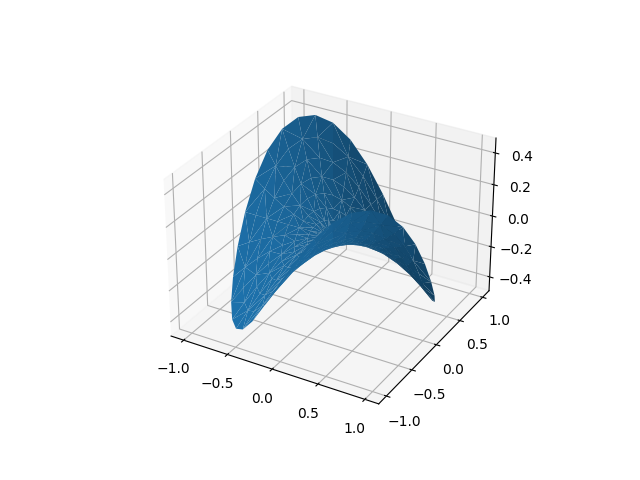
Tri-Surface plots#
See Axes3D.plot_trisurf for API documentation.
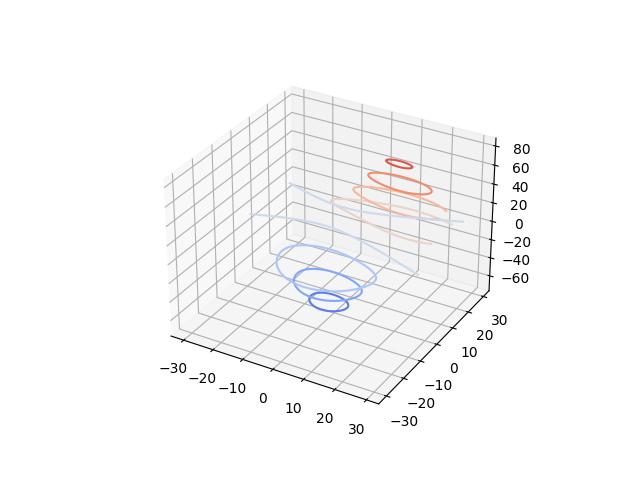
Contour plots#
See Axes3D.contour for API documentation.
Filled contour plots#
See Axes3D.contourf for API documentation.
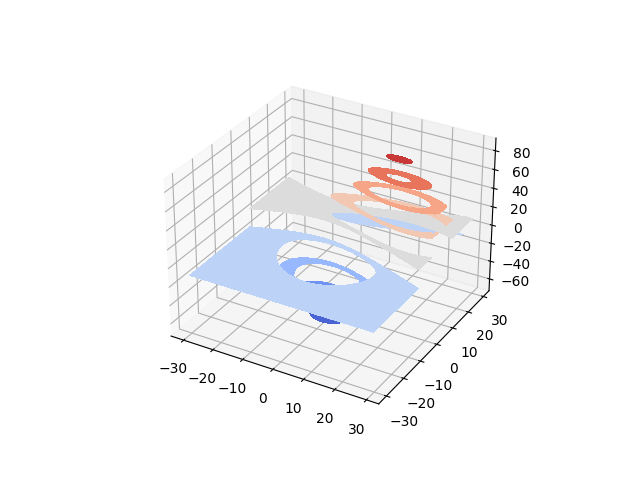
New in version 1.1.0: The feature demoed in the second contourf3d example was enabled as a result of a bugfix for version 1.1.0.
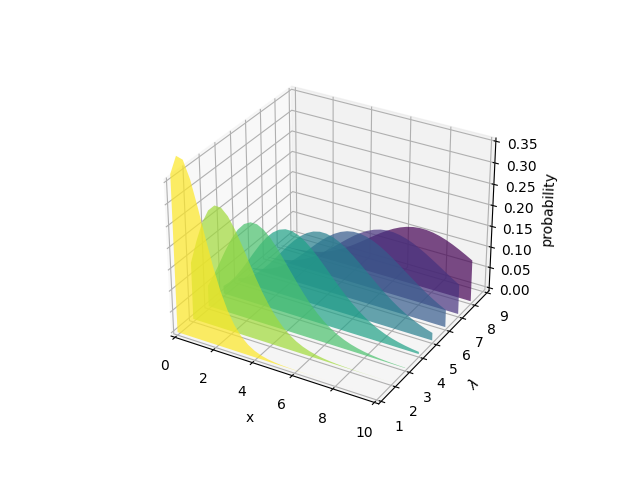
Polygon plots#
See Axes3D.add_collection3d for API documentation.
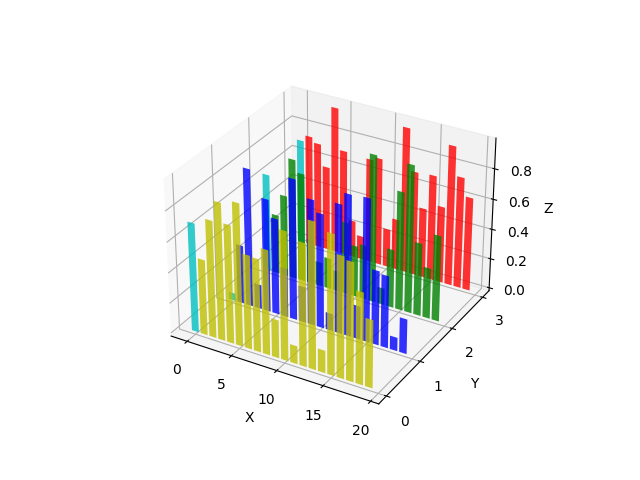
Bar plots#
See Axes3D.bar for API documentation.
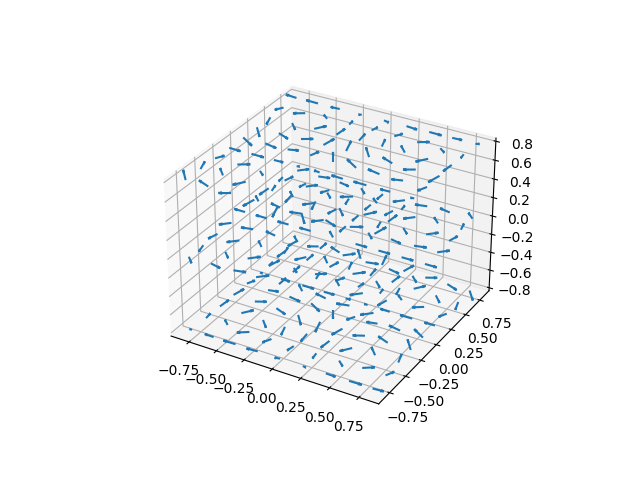
Quiver#
See Axes3D.quiver for API documentation.
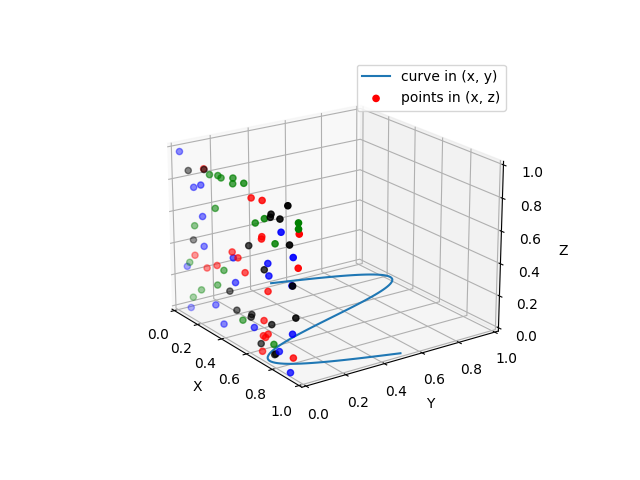
2D plots in 3D#
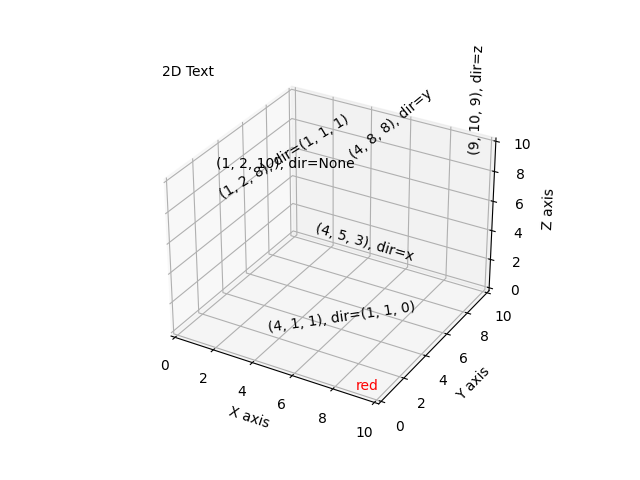
Text#
See Axes3D.text for API documentation.